
Data Driven and Equity Driven Hurricane Response: A Prioritization Framework for Understanding Where to Target Health Recovery Efforts
- By: National Network of Public Health Institutes
- Date
“From 70% of County residents losing electricity, to downed trees and powerlines littering our streets, to thousands of residents going hungry and suffering in the oppressive post-storm heat, the impact of the storm that missed us was not felt evenly across the County. Low-income and working poor communities, lacking the resources to provide for their own relief, struggle to experience the resilience many of us take for granted.”
– Excerpt from a blog post by Catalyst Miami: Irma Aftermath Painfully Exposed Extreme Poverty
Shocks like hurricanes are much harder to recover from for communities facing day-to-day stresses like poverty and insufficient healthcare. There is a significant amount of data on both shocks and stresses that can be used to prioritize resilience efforts. The availability of this data leads to a very important question for public health professionals: what tools can the public health workforce use to review data on physical, social and health risks?
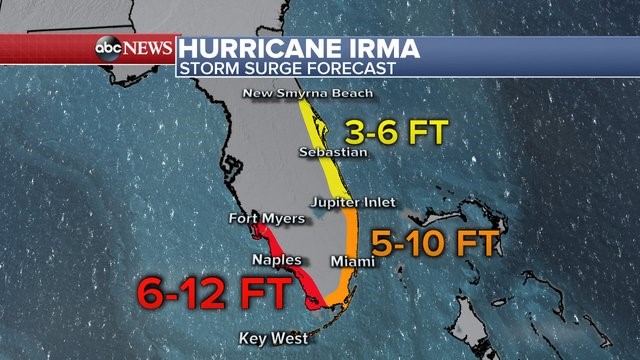 We have heard there is a need for data on where to prioritize response and recovery efforts and how to communicate risk from several of our partners. A lack of data and information can lead to poor communication, which was an issue during Hurricane Irma. Media around Florida displayed alarmist maps projecting extremely high forecasted storm surges expanding along vast spans of coastline, but these media outlets did not show how far the surge could extend inland. Reporters did not explain how, for example, if you are in Southeast Florida and live at an elevation higher than 10 feet, as most people here do, you have no surge risk. Perhaps this is why most people who could afford it evacuated (nearly one-third of the state).
In reality, storm surge height varies dramatically. Surge can vary over 10 feet vertically along one mile of coastline. While each hurricane event is different, there is always a decent estimate of where it will be relatively higher. A key factor influencing surge height is the slope of the ocean floor, which of course we know well before the storm is approaching.
 A goal of the Florida Hurricane Response Hub (FL-HRH) is to provide information to the public health workforce on where to prioritize efforts and who to target for providing health-related assistance after hurricane events. We have seen how community health workers and emergency responders are limited after a storm, in terms of staffing and resources. What if there was a tool to help them understand who needs help the most and where they live? In this article, we present ways to use data to identify vulnerable hotspots to prioritize.
Vulnerability aggregates both the likelihood and consequence of risk to a hazard. Hurricane-related health recovery is so important in Florida communities because of the high physical risk (likelihood of hurricane hazard) and social/health risks (exposures to groups impacted by inequity). One way to think of it is imagining a high storm surge impacting a low-lying area. If the area is a wetland, the ecosystems can naturally recover. So although there is a high likelihood of risk, there are low consequences in terms of human health impacts. The area might be ranked where the white star is in Figure 1.
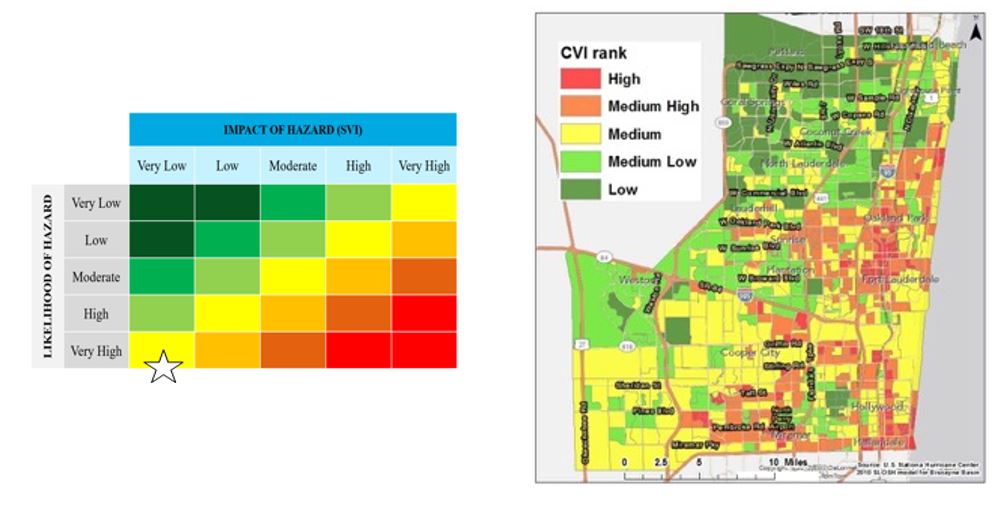
Figure 1: Vulnerability Matrix Concept. SVI stands for Social Vulnerability Index, which is an aggregate of numerous socioeconomic risk factors (such as age and income) to understand relative risk between spatial areas like census tracts. The SVI is aggregated with tract-level hazard data to produce a Coastal Vulnerability Index (CVI), as shown in the map on the right of Broward County, FL. (Source: project manager, Keren Bolter’s PhD dissertation)

Figure 2: Historic Hurricane Tracks on Record
PHYSICAL RISK FROM HURRICANES
As a peninsula located between the warm waters of the Gulf of Mexico and the Atlantic Ocean, Florida has a high likelihood of hurricane impacts. Figure 2 shows the state as a target for the historic hurricane tracks. In addition, sea level rise is increasing the foundation that storm surge builds upon. Shallow water tables and impermeable surfaces prevent stormwater from percolating into the ground.
ADDING SOCIAL AND HEALTH RISK TO IDENTIFY HOTSPOTS
The impacts of hurricanes on people are exacerbated with dense and growing coastal populations, many of which are impacted by inequity, living in low-lying areas subject to both wind and surge. When you have low-lying areas with high density of groups impacted by inequity and with health risks, you have a “triple whammy” effect. Table 1 lists specific examples for each of these and how they are connected. These areas are important to be aware of, as a surge impact to those areas will be particularly catastrophic. There should be protocol to prioritize these kinds of hotspots.
For Southeast Florida, these areas are not all coastal. Due to the shallow water table in areas that border the Everglades to the west, there are several areas where groundwater levels have risen from the Biscayne Aquifer. Water from the Everglades is flowing underground towards the east. This underground water comes up through the soil causing groundwater inundation in developed areas. This already happens several days per year, and sea level rise pushes the groundwater up further.
The FL-HRH efforts have been using the mapping results from a project completed by the Hub’s lead, Florida Institute for Health Innovation (FIHI) that applied this vulnerability matrix concept to sea level rise risk. Figure 3 (found in the slideshow below) illustrates the concept of adding a third dimension—health—to the vulnerability matrix. Figure 4 (found in the slideshow below) shows the results of the physical risks, with areas in red showing extreme vulnerability to flooding, based on minimal capacity of the soil to absorb floodwaters.
We have also been sharing tools for viewing data on likelihood and consequences of risk, such as the NOAA Coastal Flood Exposure Mapper. Figure 5 (found in the slideshow below) shows the range of datasets which this amazing tool maps for all coastal counties in the country, which enables public health professionals to identify where the hotspots are in the communities they serve.


HOW IT’S ALL CONNECTED
In addition to understanding how to overlay datasets to find risk hotspots, we also must consider the mechanisms by which each hazard impacts each population. Table 1 focuses on three impacts of sea level rise, and how each leads to different health risks for different groups impacted by inequity. Some specific examples are highlighted below:
- Hurricane winds and storm surge can lead to loss of power and property damage, and this is particularly challenging for elderly populations. Community health workers find it more difficult to evacuate older residents before or after a storm due to issues such as limited mobility. There are elevated health risks correlated to impacts that storms have on their overall physical and mental health. During Hurricane Irma, there were 12 deaths that occurred at a nursing home in Hollywood, FL that lost power.
- Increased flooding and limited health care access are of particular concern for low-income populations, especially those with preexisting conditions. We heard from community health workers about diabetic individuals that lost limbs when they could not access their insulin after a storm.
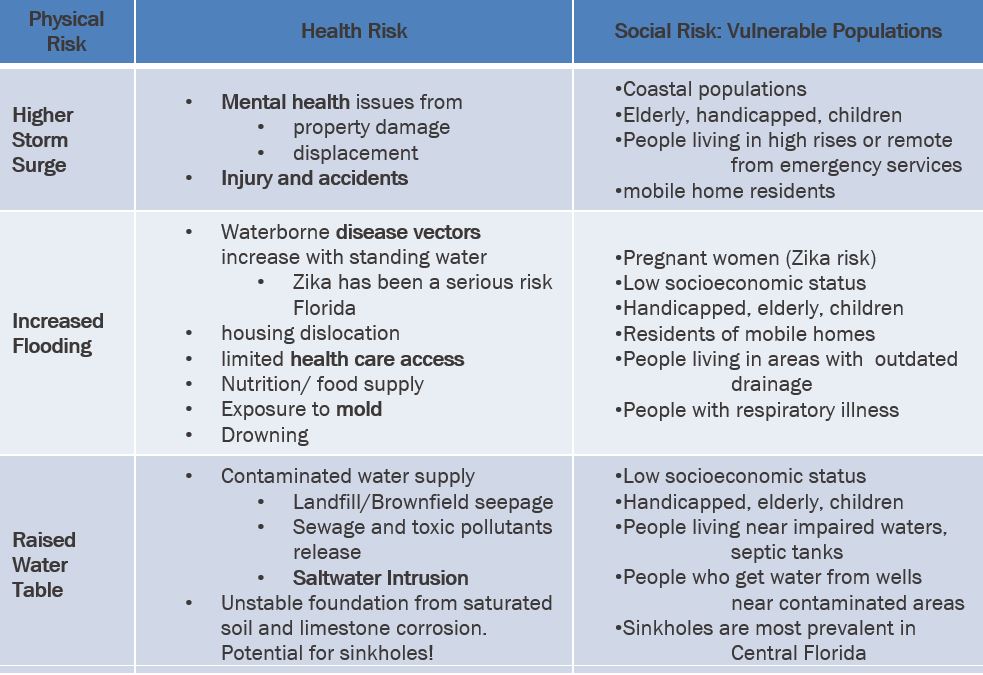
Table 1: Health impacts of sea level rise compiled from Natural Resources Defense Council, Center for Disease Control, US Environmental Protection Agency, World Health Organization, National Institute of Environmental Health Sciences resources.
– Article written by Keren Bolter, PhD, Senior Planner Urban and Coastal Resiliency, Arcadis.
LEARN HOW TO USE THE TOOL VIA LIVE DEMO
How do you know if your coastal community is exposed to flood hazards and could be at risk of damaging impacts from these hazards? Sign up today for the NOAA Coastal Flood Exposure Mapper Tool Demo: Focus on Storm and Health Layers hosted by the Florida Hurricane Response Hub. Taking place October 24th, 2019 at 12:00 PM EST, the demo will give an overview of the data layers and how to create user-defined maps that show the people, critical facilities, and natural resources exposed to coastal flooding. The maps can be saved, downloaded, or shared to communicate flood exposure and potential impacts. In addition, the tool provides guidance for using these maps to engage community members and stakeholders. Find out more by registering here.
HOW YOU CAN GET INVOLVED
To request technical assistance from one of the HRH technical assistance centers, submit the request below and a representative from an HRH technical assistance center will contact you within two business days.
Read More Articles from The Hub Speaks
Reflections: Hurricane Dorian & The Hurricane Response Hub
Learning Opportunities: Resources for Hurricane Readiness & Recovery, Quarter III
 Subscribe To Our Communications